Spectrum, windows and transmission bands
The visible range ends at 700 nm — all of telecom works in the infrared. The O·E·S·C·L bands (+ the maintenance U band) are the modern nomenclature; windows I/II/III are the historical names. The characteristic "bump" at 1383 nm is the hydroxyl (OH⁻) peak — in older fibers it separated windows II and III; in G.652.D fibers it is practically eliminated.
bands: O 1260–1360 · E 1360–1460 · S 1460–1530 · C 1530–1565 · L 1565–1625 · U 1625–1675 (maintenance)
Fiber color codes in a buffer tube
There is no single worldwide standard for fiber ordering — every network owner may define it their own way. Without technical documentation, the owner's guidelines or the cable manufacturer's specification, fall back on the table; in multi-tube cables the red buffer tube comes first, and the direction of numbering is indicated by the blue tube (or another colored one when the rest are white or black). The ordering should be consistent across the entire network.
| No. | IEC 60304 | Telefonika / Elmat / Fibrain | Orange Polska | Corning ANSI/EIA-359A | ACOME |
|---|
Decibels and dBm
dB describes a power ratio (loss/gain), dBm — absolute power relative to 1 mW. Two anchors worth knowing by heart: 3 dB = half the power, 10 dB = ten times.
| dB | power ratio |
|---|---|
| 0.1 | 1.02× |
| 0.3 | 1.07× |
| 1 | 1.26× |
| 3 | 2× |
| 6 | 4× |
| 10 | 10× |
| 13 | 20× |
| 20 | 100× |
| 30 | 1,000× |
| 55 | 316,228× |
| dBm | mW |
|---|---|
| −10 | 0.10 |
| −6 | 0.25 |
| −3 | 0.50 |
| 0 | 1.00 |
| +3 | 2.00 |
| +6 | 3.98 |
| +10 | 10.0 |
| +17 | 50.1 |
| +20 | 100 |
| pulse duration | length in the fiber |
|---|---|
| 3 ns | 0.3 m |
| 10 ns | 1 m |
| 30 ns | 3 m |
| 100 ns | 10 m |
| 300 ns | 30 m |
| 1 µs | 100 m |
| 2 µs | 200 m |
| 10 µs | 1 km |
| 20 µs | 2 km |
red power levels = hazardous to the eyes · pulse length ≈ duration[ns]/10 meters (N≈1.5)
PLC splitter insertion losses
| PLC splitter | 1×2 | 1×4 | 1×8 | 1×16 | 1×32 | 1×64 | 1×128 |
|---|---|---|---|---|---|---|---|
| theoretical [dB] | 3 | 6 | 9 | 12 | 15 | 18 | 21 |
| typical [dB] | 3.5 | 6.9 | 9.8 | 13.5 | 16.5 | 20.0 | 23.5 |
| maximum [dB] | 3.9 | 7.4 | 10.8 | 13.8 | 16.9 | 21.0 | 25.3 |
Loss budget of PON classes
The total loss of the OLT–ONT path (fiber + splitters + connectors) must fit within the range of the class in which the active equipment operates (Table 5 of the handbook):
| PON class | A | B | B+ | C | C+ |
|---|---|---|---|---|---|
| minimum insertion loss [dB] | 5 | 10 | 13 | 15 | 17 |
| maximum insertion loss [dB] | 20 | 25 | 28 | 30 | 32 |
Note: the path must not be too low-loss either — below the minimum, the receiver is overdriven. Newer standards add class C++ (>32 dB).
Allowed losses in connectors
| MM PC | SM PC | SM APC | |
|---|---|---|---|
| typical insertion loss [dB] | 0.3 | 0.3 | 0.3 |
| maximum insertion loss [dB] | 0.6 | 0.6 | 0.6 |
| typical insertion — Orange Polska requirements [dB] | 0.15 | 0.15 | 0.15 |
| maximum insertion — Orange Polska requirements [dB] | 0.25 | 0.25 | 0.25 |
| minimum return loss [dB] | 40 | 55 | 65 |
| minimum return — Orange Polska requirements [dB] | 45 | 60 | 75 |
Typical values — what a measurement should give
A quick sanity check of a trace: if the result strays from these orders of magnitude, suspect the measurement first (settings, cleanliness, launch cord), and only then the line.
| G.652 fiber | 1310 nm | 1550 nm | 1625 nm |
|---|---|---|---|
| attenuation [dB/km] | 0.33–0.35 | 0.19–0.20 | 0.21–0.22 |
| Event | typical loss | reflectance | trace signature |
|---|---|---|---|
| splice | 0.02–0.1 dB | no reflection | a clean step down; the same loss at every wavelength |
| PC connector | 0.3 / max 0.6 dB | approx. −45 dB | step + a distinct reflection peak |
| APC connector | 0.3 / max 0.6 dB | ≤ −60 dB | step; peak visible only with a short pulse |
| macrobend | wavelength-dependent | no reflection | loss grows with wavelength: 1625 ≫ 1550 ≫ 1310 — measure at two wavelengths |
| PLC splitter 1×N | per the splitter table | practically none | a large step; often the end of the dynamic range beyond it |
| open connector / fiber end | — | approx. −14.7 dB (4%) | a tall peak and a drop into the noise |
| ghost | 0 dB | a peak "out of thin air" | a reflection with no loss, at a multiple of the spacing of strong reflections |
Remember: splice and connector loss for the report = the average of a bidirectional measurement (A→B and B→A with the same settings) — chapter 5.
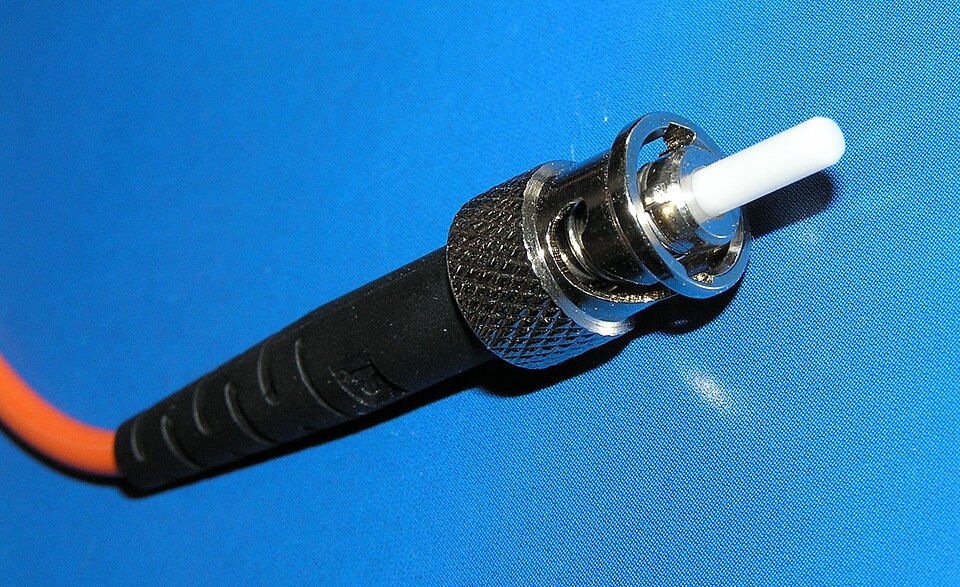
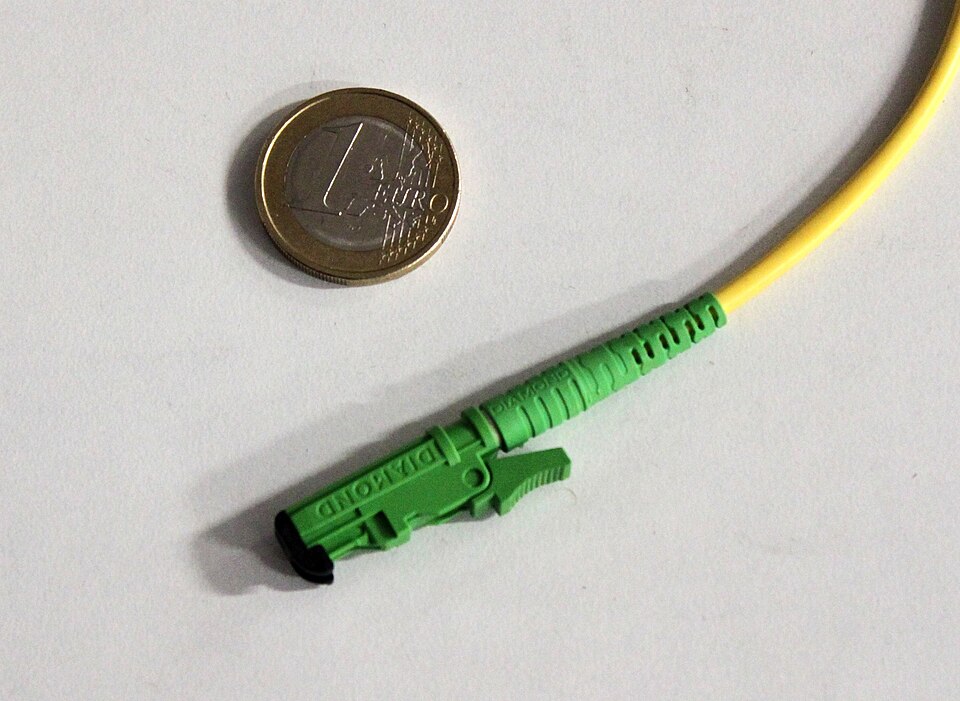
Connectors — recognize them at a glance
Housing color: green = APC (8° endface), blue = PC single-mode, beige/black = multimode. The rest is in the table:
| connector | ferrule | coupling | where you'll see it | cleaner | |
|---|---|---|---|---|---|
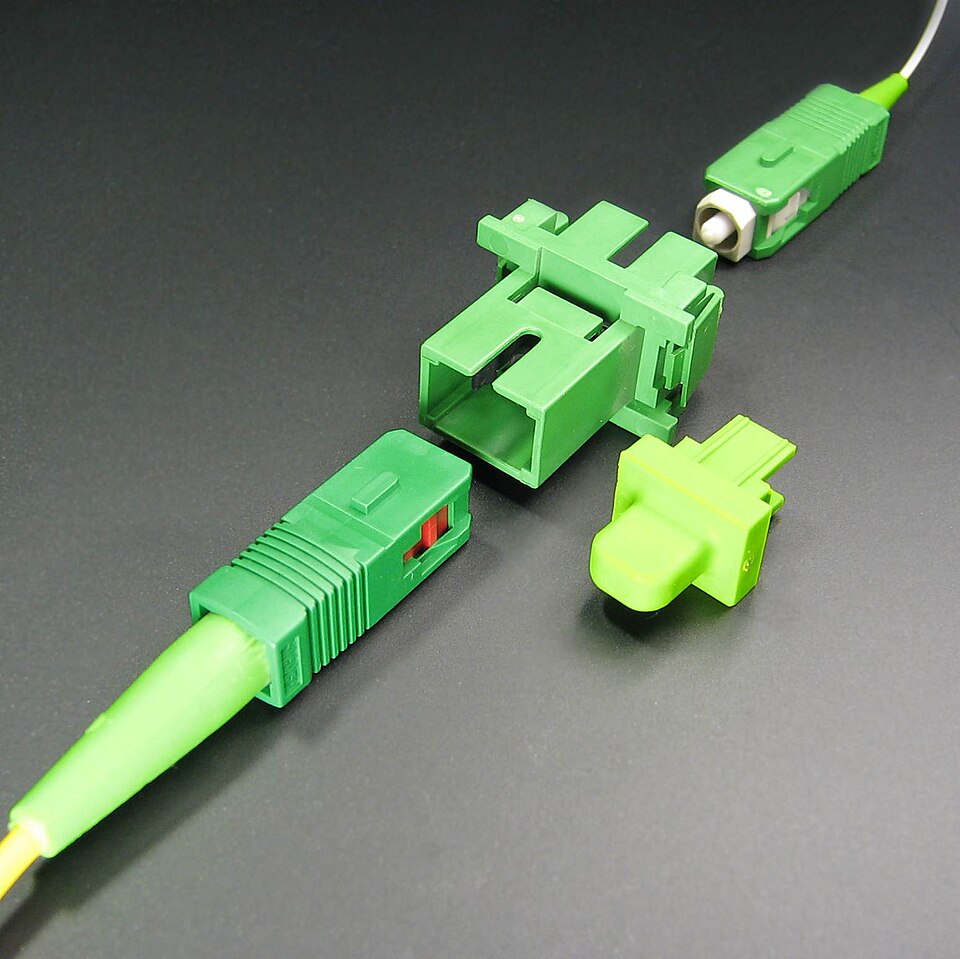 | SC | Ø 2.5 mm | push-pull | patch panels, PON (subscribers: SC/APC) | 2.5 mm |
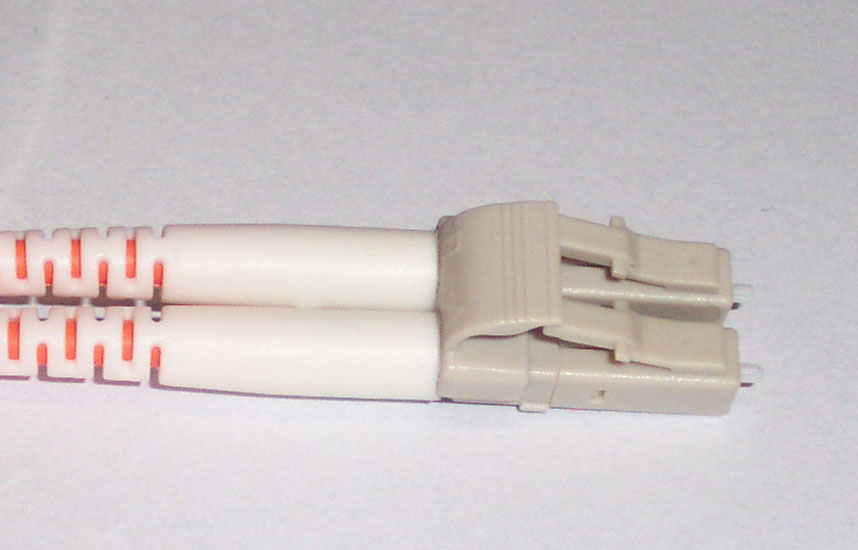 | LC | Ø 1.25 mm | latch (like RJ-45) | SFP/SFP+, data centers, high-density patch panels | 1.25 mm |
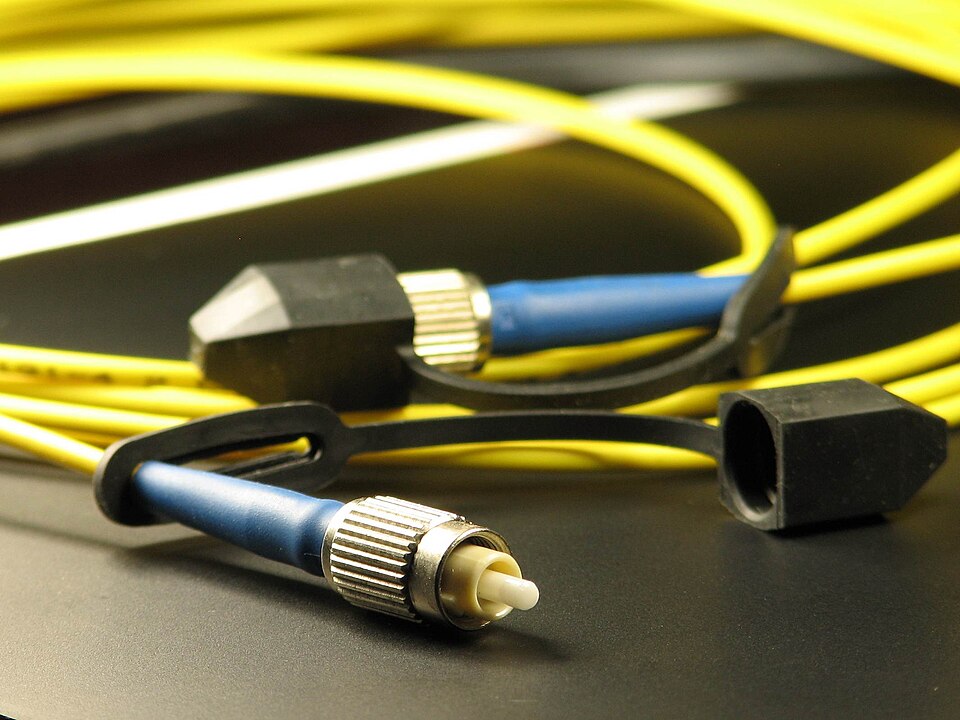 | FC | Ø 2.5 mm | threaded | test equipment, laboratories, OTDR ports | 2.5 mm |
 | ST | Ø 2.5 mm | bayonet | older LANs, multimode installations | 2.5 mm |
 | E-2000 | Ø 2.5 mm | push-pull + shutter | carriers, DWDM (usually APC) | 2.5 mm |
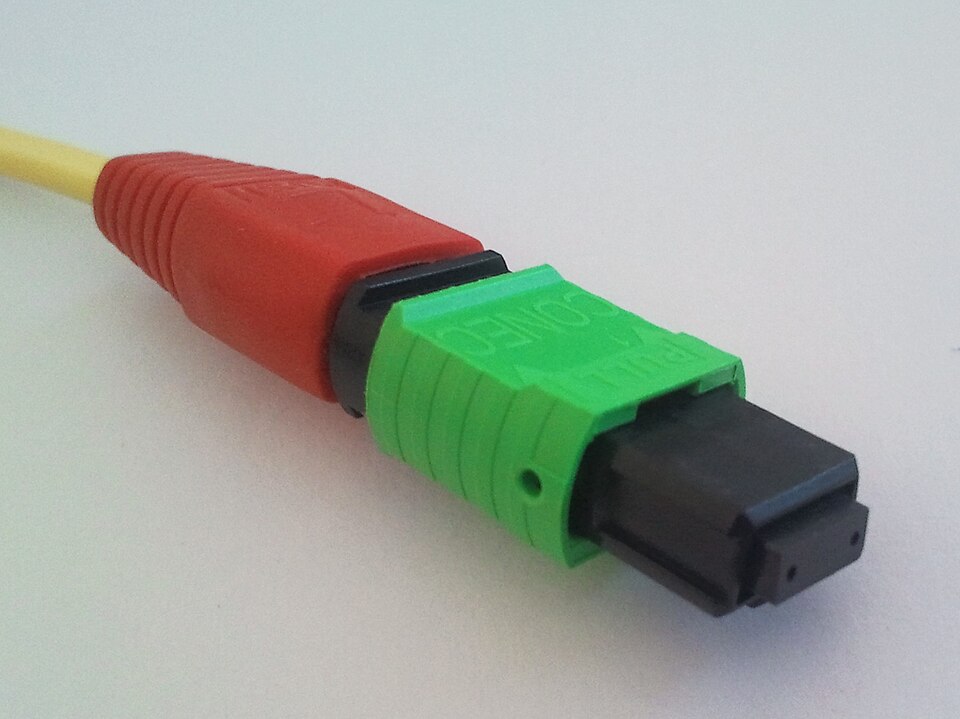 | MPO/MTP | rectangular, 12/24 fibers | push-pull, polarity key | data centers, 40/100G links | MPO/MTP |
Connector photos: Wikimedia Commons — SC/FC: A. Popov (CC BY-SA 4.0); LC: Marco Götze (CC BY-SA 3.0); ST: Yannick Trottier (CC BY 2.5); E-2000: Christophe Finot (CC BY-SA 3.0); MPO: Kirnehkrib (CC BY-SA 3.0).
Cleaner selection
The ferrule diameter from the table above points to the right tool — the full cleaning workflow (dry → wet → dry → inspection) is in chapter 2.
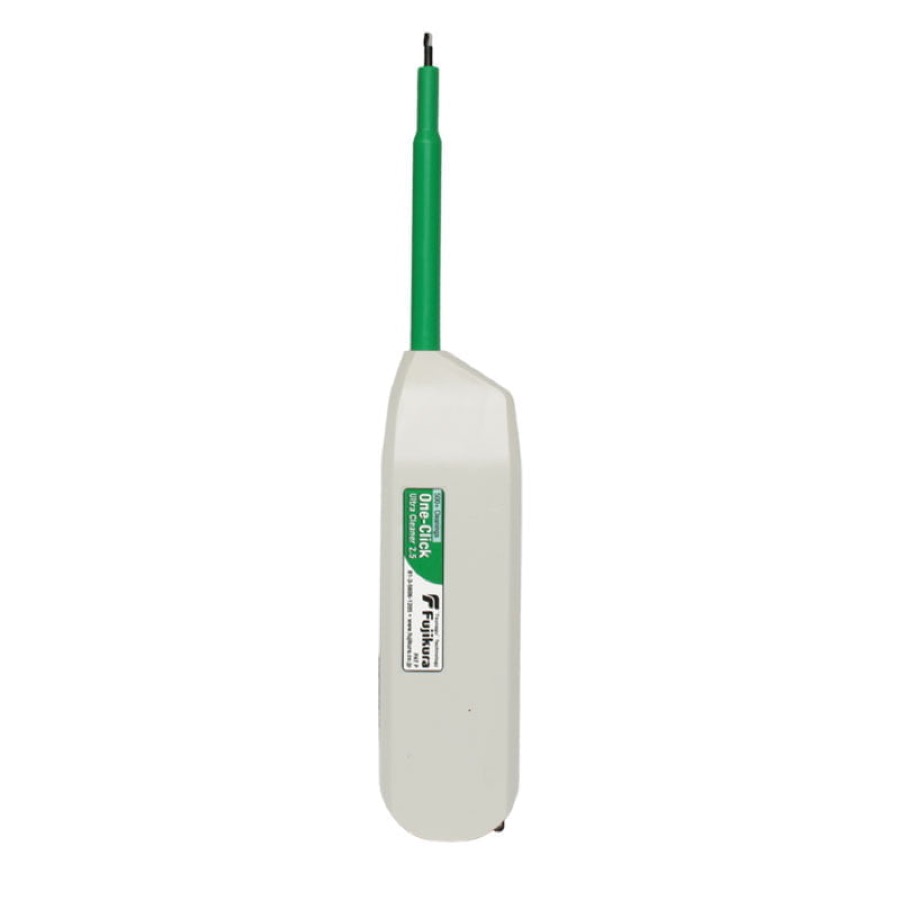 One-Click 1.25 / 2.5 mmLC, MU / SC, FC, ST, E-2000 — including bulkhead connectors
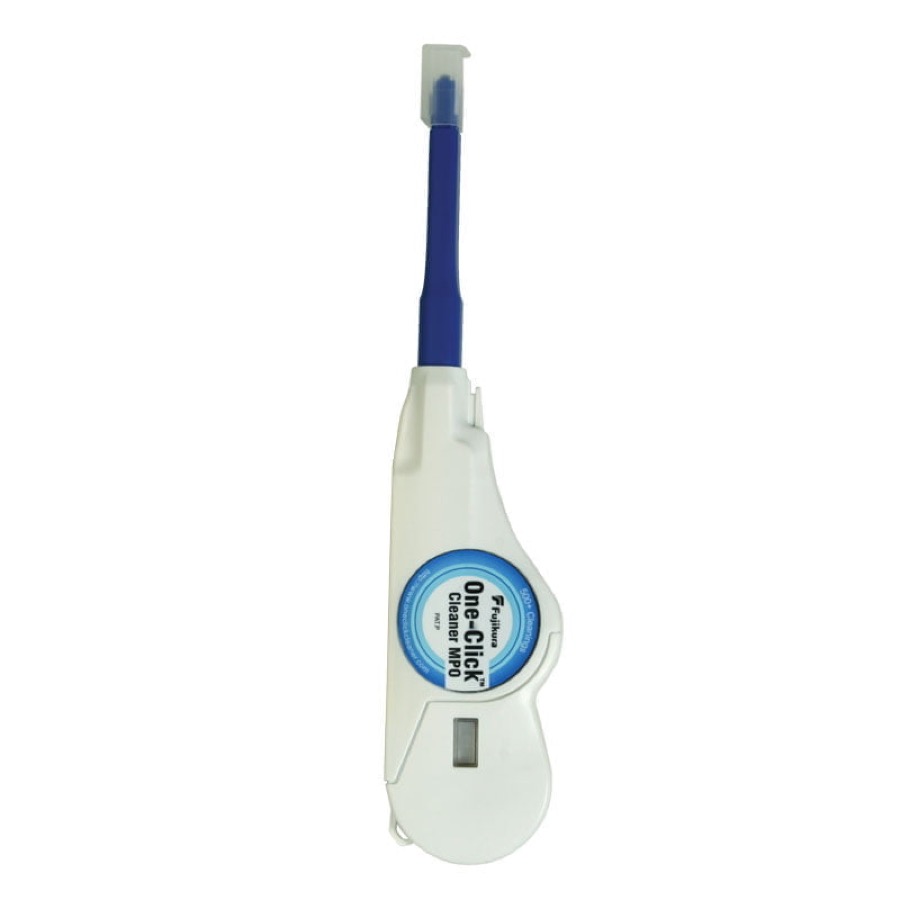 One-Click MPO/MTPdedicated to multi-fiber ferrules
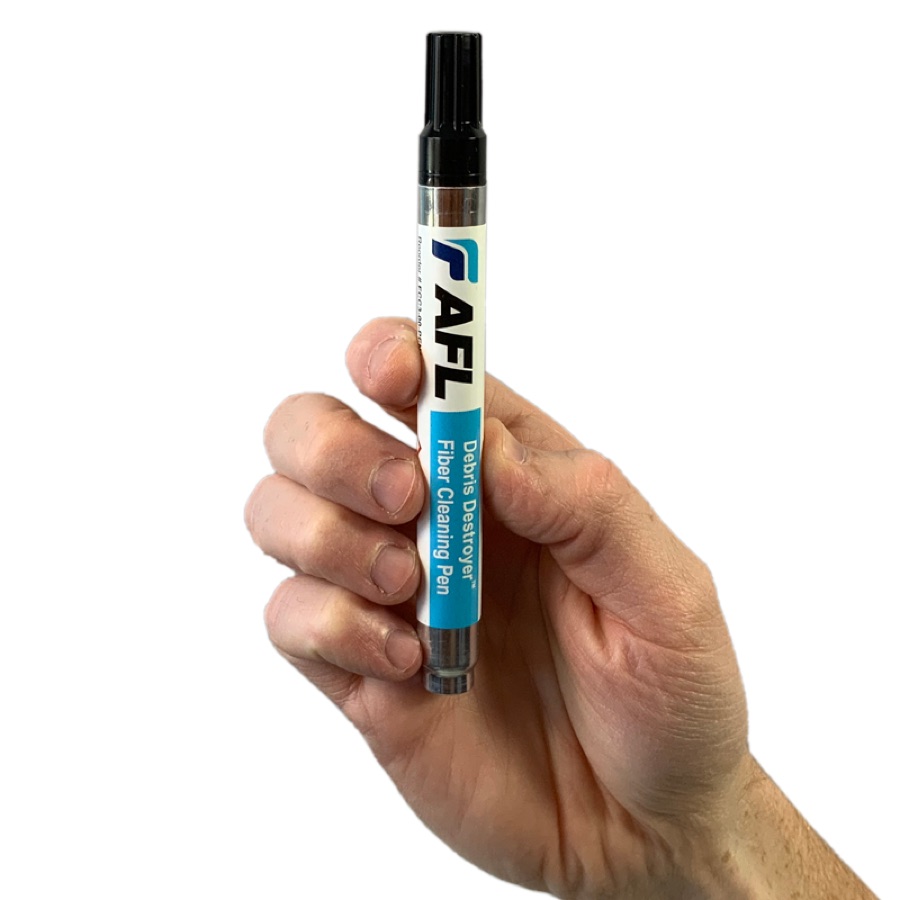 FCC3 pen + FCC2 fluidwet cleaning of stubborn contamination
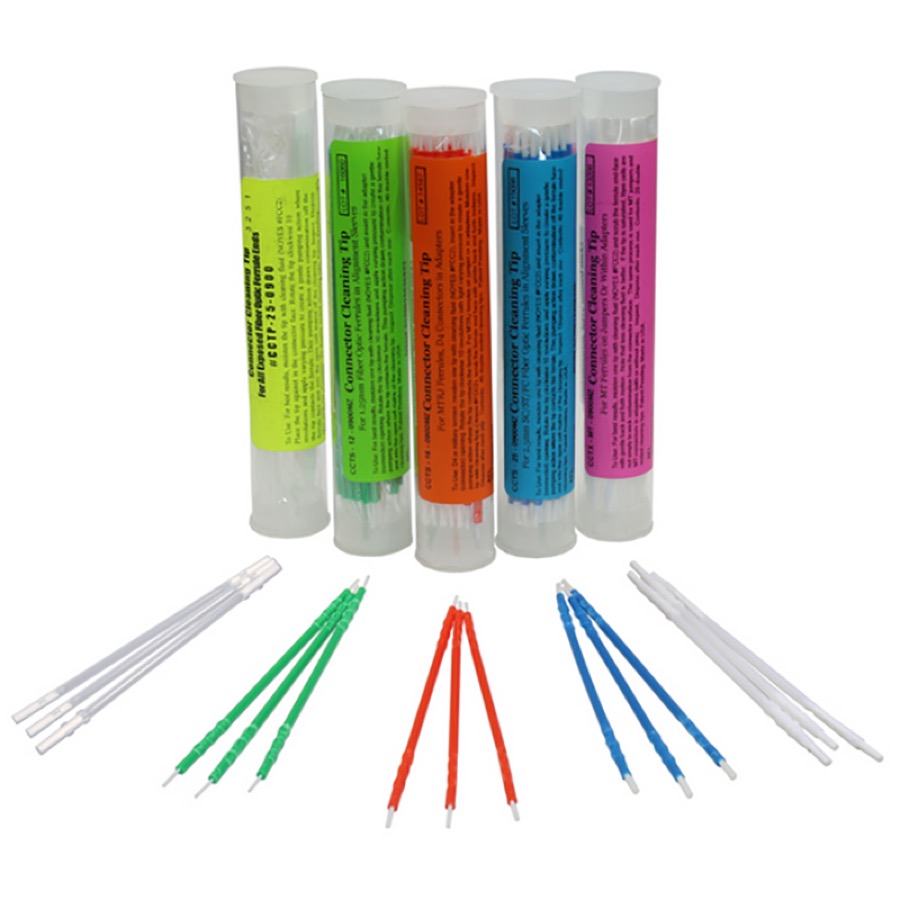 CCT tipsadapters and hard-to-reach ports
Cleaner photos: AFL materials / interlab.pl.
Glossary of abbreviations and definitions
You'll find the inspection and cleaning workshop in chapter 2, and what these numbers mean on a trace — in chapter 5.