The principle is simple: first you measure the reference power P₁, then you insert the line and measure P₂. Insertion loss L = P₁ − P₂. The devil is entirely in what was in the path during the reference measurement — because that decides how many connectors end up in the result.
switch methods and compare the result L for the same line · red rings = connectors whose loss stays in the result
The same line, three correct measurements — and three different results. Method 1a adds two connectors, 1b one, and 1c measures the line alone. That is why a test report always states the referencing method.
Where this comes from
In method 1a the reference is just the source with a single test cord — so both connectors at the ends of the line are added in the measurement. In method 1b the reference already contains one cord-to-cord connection, so one connector remains in the result. In method 1c the reference passes through two adapters and a reference cord — after removing it and inserting the line, the number of connections does not change, so the result is the pure insertion loss of the line. The choice of method is dictated by the available connectors/ports and the specification requirements.
A practical shortcut: most power meters let you store P₁ as the 0 dB level — then P₂ directly reads the insertion loss of the line.
Choosing the test set
Light source: a wavelength matching the transmission systems that will operate on the line — for single-mode typically 1310 and 1550 nm (measure at both wavelengths!), power and wavelength stability, spectral width determined by the emitter type (LED / FP / DFB).
Test cords: 2–5 m, with fiber that strips cladding modes; single-mode cords are fitted with 80 mm diameter loops. The quality of their connectors must be at least as good as the connectors in the links under test — and they must not be disconnected from the source between the reference and the measurement.
Optical power meter: dynamic range and calibration for the wavelengths in use, linearity across the full range, and the lowest possible polarization dependence of the detector (it grows with the active area).
Modern test sets simplify the procedure: Wave ID technology automatically recognizes the wavelength and measures at two–three wavelengths simultaneously, while OTDRs with a built-in source and power meter (e.g. the AQ1200 family) perform a remote reference measurement through the fiber under test. Results are stored in the instrument and a report is generated — priceless with hundreds of fibers.
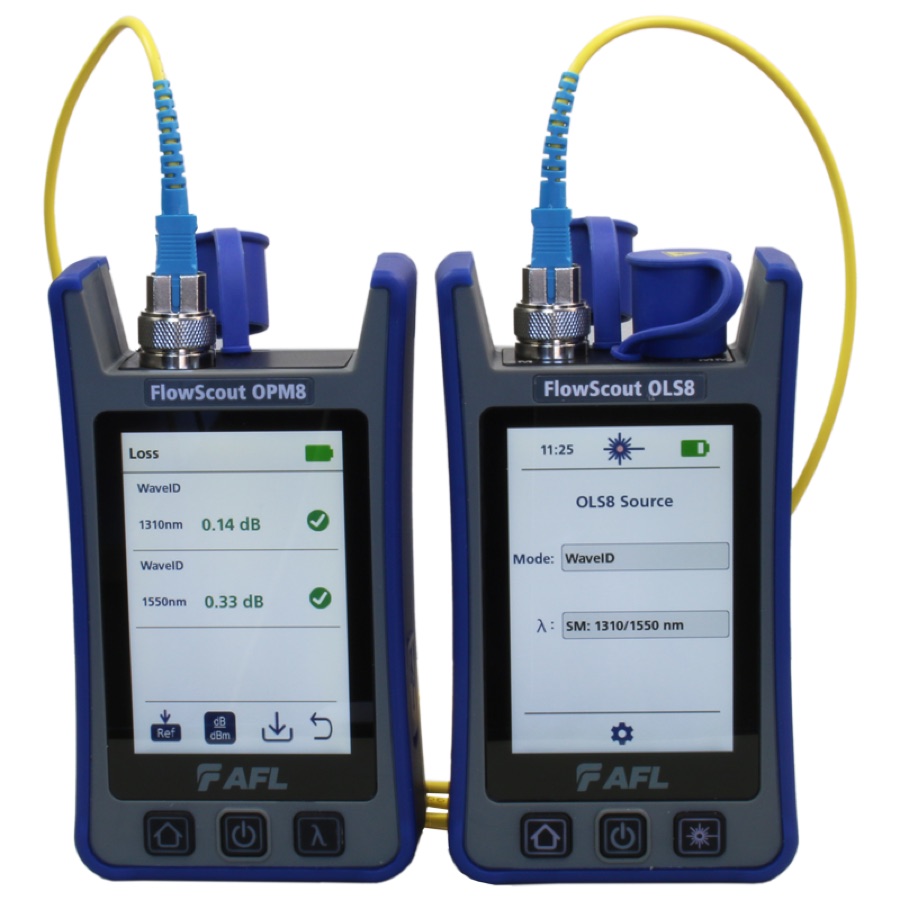
Methods 1a/1b/1c in practice: AFL FlowScout OPM8 + OLS8
Exactly the measurement you practiced above: a smart light source and power meter with Wave ID, measurement at two wavelengths simultaneously, results memory and reporting for hundreds of fibers.
See it at INTERLAB →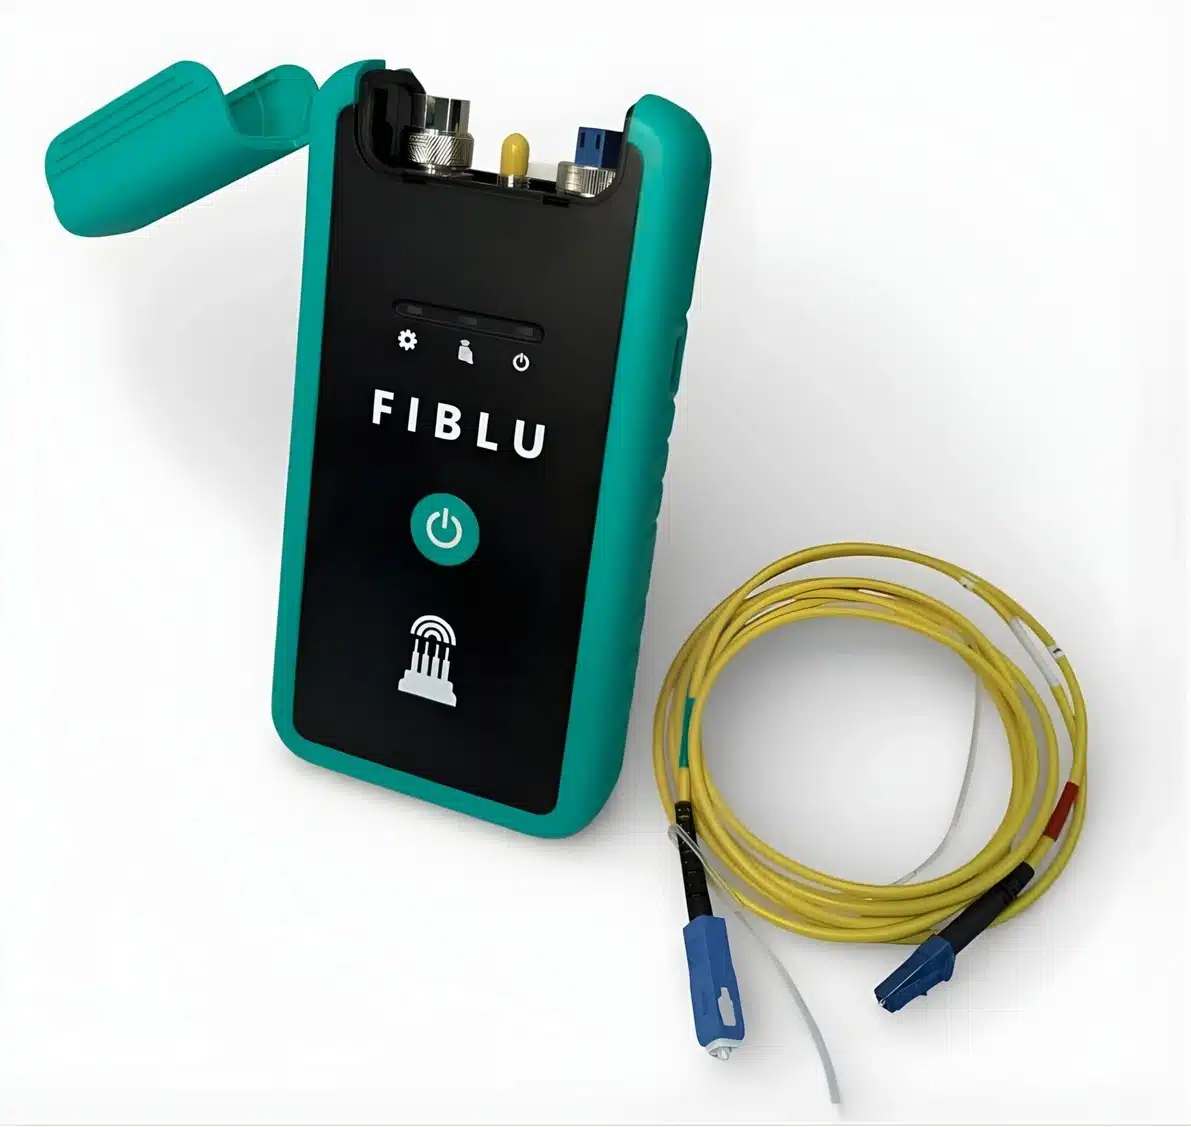
When the result must be a certificate: AEM FiBLU
Where the client requires a standards-based report (Tier 1 certification), insertion loss is measured with an application tester: AEM FiBLU guides you through referencing, watches the limits and generates the report itself in the UniBlu app.
See it at INTERLAB → AFL SLP5-6D
 AFL Contractor Series
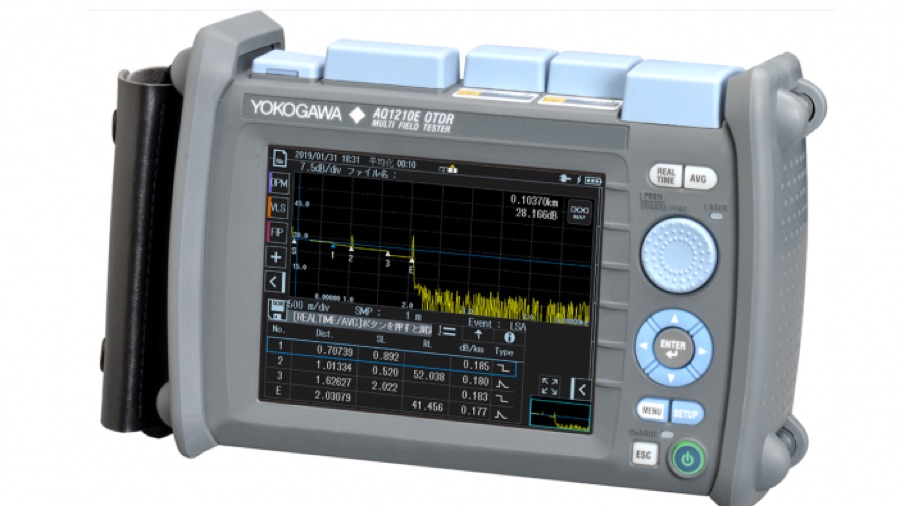 Yokogawa AQ1210
Method 2 — measuring insertion loss with an OTDR — has a chapter of its own: OTDR Event Analysis.